
Guide to Planning Map Symbols for UK Applications
Understand the OS map detail underneath your application and the planning information added on top.
Not sure what the colours, lines and small marks mean? This guide separates base-map features from red and blue planning boundaries, north points, scale information and proposed work.
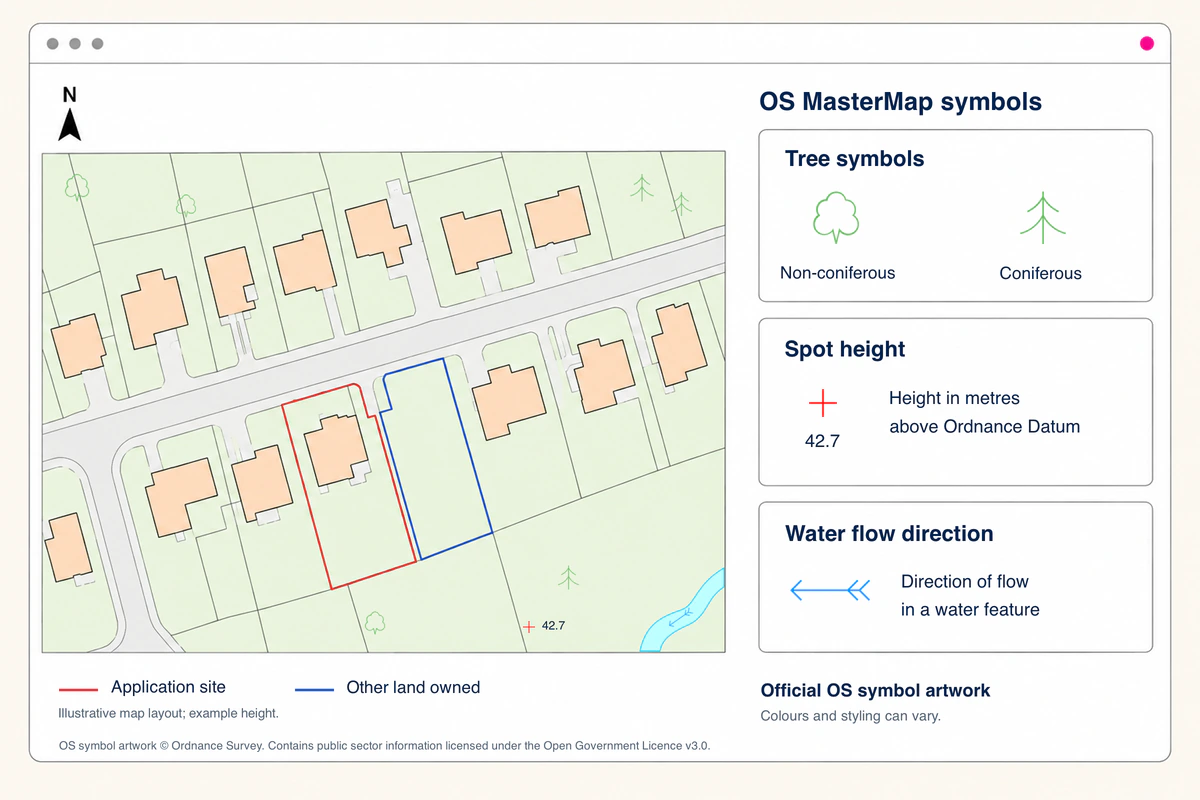
Planning maps are full of lines, fills, small marks and abbreviations. Some describe what is on the ground; others are added for the planning application. Knowing which is which makes a plan much easier to check.
This guide to planning map symbols covers the markings applicants are most likely to meet. It also looks at the Ordnance Survey symbols beneath them, so a fence, tree or water feature is not mistaken for an application boundary.
What planning map symbols are for
A location plan identifies the site within its wider surroundings. A site plan or block plan gives a closer view and may show the development, access, parking, trees and neighbouring buildings. Symbols help the reader separate this information without covering the mapping below.
There are two sets of marks to read. The OS base map represents real-world features such as buildings, roads, paths, water and vegetation. The applicant or designer then adds red and blue boundaries, proposed-work outlines and labels. An OS line does not become a planning boundary simply because the red line follows it.
Requirements vary across the UK. Read the local planning authority's current validation checklist. In Northern Ireland, check the council's requirements and the appropriate OSNI product. Correct symbols cannot guarantee validation or planning permission.
The essential planning map symbols
Red line: the application site
The red line identifies the land to which the application relates. Under planning application guidance for England, it should include all land needed to carry out the development, including relevant access from a public highway, landscaping, parking or visibility splays. Other UK jurisdictions and councils may give different or additional instructions.
Draw a continuous line without hiding roads, buildings or labels. It may follow an OS feature such as a wall, fence or kerb, but that feature does not itself define the application site. See the red line boundary guide for more detail.
Blue line: other land in the applicant's ownership
A blue line is used where required for other nearby or adjoining land owned by the applicant but outside the application site. It is not a second outline around the red line or a mark for somebody else's land.
Ownership certificates and notices are separate. Neither an OS feature line nor a coloured boundary proves the precise legal or title boundary. If ownership or a shared drive matters, check the title information and take suitable advice.
A north point and scale information
The north point shows how the plan is orientated. It must remain correct if the map is rotated and should not cover essential detail. The stated scale relates a measurement on the printed plan to the distance on the ground.
Location plans are typically 1:1250 or 1:2500. A site or block plan's scale depends on the proposal and validation requirements; 1:200 and 1:500 are common options. Do not assign a scale automatically to a town or countryside site. Choose enough coverage while keeping detail readable.
Print at the specified paper size using 100% or “actual size”. After enlargement or reduction, the drawing no longer has its stated scale. A scale bar changes with the page and stays proportionally useful, but it does not make the written scale correct after resizing.
Existing and proposed features
The OS map records existing topographic features, not your proposed extension, new drive or removed fence. Add proposed work on the appropriate plan with a simple outline, restrained shading and a direct label. Include a small legend if several marks are used.
Keep “existing”, “proposed” and “to be removed” visibly different. Leave detailed design information for the block plan, floor plan or elevation.
How to read OS MasterMap Topography Layer symbols
OS MasterMap Topography Layer represents real-world features across Great Britain. Its information is organised as areas, lines and points, with separate symbols, text and administrative boundaries. These parts combine to make the finished base map.
Symbols are clues, not a substitute for checking the site. They show how OS has represented a feature, not ownership, a planning designation, a right of way or what development may be allowed.
Areas and colour fills
An area fill covers a mapped shape. Buildings and structures are normally distinct from roads, paths, tracks and other hard surfaces. Natural areas may show grass, scrub, woodland or mixed vegetation, sometimes with repeated symbols. Water fills distinguish ponds, lakes, rivers or canals.
Treat colours as guidance, not universal codes. OS provides standard, light, backdrop and outdoor styles, while suppliers and GIS users can apply other stylesheets. Colour, line weight and detail can change with the style, software and scale. Read the legend for the particular map rather than relying on a remembered shade.
Lines, boundaries and levels
Lines can represent a building edge, wall, fence, kerb, path, track, water, rail feature or landform. Solid and broken lines may distinguish visible, overhead or underground detail, but appearance depends on the stylesheet. A dashed line is not automatically a public right of way, ownership boundary or proposed feature.
Administrative boundaries can also appear. These differ from red and blue planning markings and Land Registry title information. Where lines meet, use the labels and map key rather than guessing from style alone.
OS MasterMap Topography Layer contains known-height points rather than a complete set of contours. A spot height is a measured ground level, usually with a height value; it is not a proposed level. A benchmark marks a surveyed reference, while a triangulation station identifies a national-survey control feature. These do not replace a measured topographical survey where design depends on accurate levels.
Point symbols, text and height marks
Point symbols include individual coniferous and non-coniferous trees, boundary posts, benchmarks and triangulation stations. A repeated pattern may describe vegetation across an area rather than plot every plant or tree in its exact position.
Water symbols can include a culvert or direction-of-flow arrow. Do not confuse that with a north arrow or an applicant's access arrow. Cartographic text gives names, descriptions and height figures. Read a symbol with nearby text, lines and fills because an isolated mark can be ambiguous.
Not every small feature appears, and symbols can change or disappear with display scale. If a tree, drain, boundary treatment or level affects the proposal, verify it on site and add the information requested by the council.
How to keep colours and annotations clear
Let the base map remain visible. Use boundaries thick enough to reproduce clearly, but not so heavy that they conceal entrances, kerbs or building edges. Keep labels short, place them away from road names and use a legend when the meaning is not immediately obvious.
Check the final PDF rather than only the online preview. Make sure the red and blue lines remain distinct, proposed works can be separated from existing features, and the north arrow, scale bar and licence details are present and legible. A colour plan should still make sense when viewed on an ordinary screen or printed by the council.
Common mistakes that cause avoidable queries
Common errors include mistaking a physical OS line for the legal ownership boundary, drawing the red line only around the proposed building, leaving necessary access outside it, or adding unexplained coloured shapes. Another is assuming that a symbol proves a feature's current condition without checking the site.
A customer review featured on the UK Planning Maps homepage gives a practical example. Mr Wellden reported that the red outline was missing from his first map and that online chat resolved it. Open the downloaded PDF and check the annotations rather than relying only on the preview.
Maps can also become misleading when cropped too tightly or printed using “fit to page”. Missing north, unreadable text and a faint boundary may create a validation query even where the correct site was originally selected. For anything uncertain, compare the finished drawing with the application form, design drawings and local checklist.
A practical check before you submit
Ask somebody unfamiliar with the property to read the plan. Can they find the site, follow the complete red line and tell which marks belong to the OS map and which describe the application? Can they identify north, the scale and the proposed work without guessing? That simple test often finds problems quickly.
UK Planning Maps supplies licensed, georeferenced OS MasterMap-based plans with a north arrow, scale bar and licence details. You can add red and blue boundaries using the drawing tools and receive the PDF immediately. Start by finding your planning map, then check every symbol and annotation against the council's current requirements before submitting it.
Ready to Get Your OS Plans?
Every plan is instantly downloadable, Planning Portal‑compliant, and includes all required elements. Get your plan now and submit your application with confidence.